How to Extrapolate Along Yield Curve
Recently, during my lecture about financial instruments, I got a very interesting question from one clever participant. To give you a little background: He was a finance guy working in a huge company and for sure, he came across various accounting issues and problems. One of his tasks was to prepare valuation of corporate bonds held by his employer as at the year-end in line with IAS 39/IFRS 9. Those bonds were held at fair value through profit or loss, so at the year-end, this guy would have to determine their fair value.
BUT—here the problem lies. None of those bonds is traded on a public market, so looking to market data just does not help. So, what the company used to do—to outsource the valuation of those bonds to pretty expensive valuation expert. However, in this damn financial crisis, everybody is cutting costs, so finally we get to the question: can we do it somehow by ourselves? Is there any simple method of bond valuation, executable with simple means, without expensive software—just with what we already have?
You bet there is—extrapolation along a yield curve. I simply love this method, as it’s fast, simple, doable in Excel or other table processor and accepted by most auditors. One might object that there are more precise valuation or pricing techniques, such as arbitrage-free pricing, relative pricing and many others. That’s all true, but this method is at least as good as the others—as soon as you can justify selection of your base information for a yield curve.
What is a yield curve?
Well, yield curve is simply relationship between “years-to-maturity” and “yield to maturity” of a certain bond. To explain it shortly:
Years-to-maturity is the time from now (or any other settlement date) until bond’s maturity. It the yield curve, it represents axis X.
Yield to maturity (YTM) is the real interest that bonds pays you from now until its final maturity date, expressed as a percentage, or rate. It depends on the bond’s coupon (regular nominal interest payments by bond’s issuer), bond’s current market price (or your current investment to acquire that bond) , bond’s redemption (whether at the bond’s maturity, you receive it’s nominal, or some other amount) and of course, time from now to maturity. Simply speaking, yield to maturity is the internal rate of return of the bond at current market price. It the yield curve, it represents axis Y.
You need the data of at least 2 bonds to draw a yield curve, but of course, more data gives you more accurate yield curve.
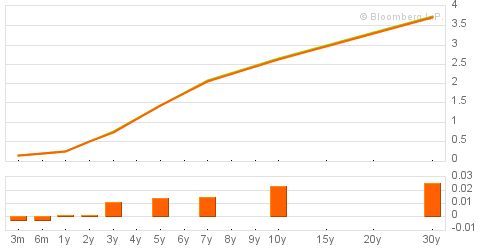
Typical yield curve would look like the following:

This one is taken from bloomberg.com. As you can see, it’s sloping upwards. What does it mean? It means that the shorter maturity bond has, the lower yield or “real interest” pays to its holder and vice versa. Normally this is OK, because longer maturities generally carry more credit risks, more inflation risks, etc. and therefore, investors require higher yields.
Sometimes, the yield curve slopes downwards. In such a case, it’s called inverted yield curve and can be a sign of a recession. Sometimes, the yield curve can take a flat shape. In such a case, market just does not know what to think as there is no difference between returns from short-term and long-term securities and market expectations are just confusing. But that’s not what I want to discuss here.
How can we set bond’s market price from yield curve?
Fine, fine, but what should we do with this? Well, haven’t I written above that this was going to be a basis for our bond valuation?
Yield curve represents certain trend line of relationship between years-to-maturity and yield-to-maturity and is drawn based on the data about a few or a lot of different bonds with different years-to-maturities, market prices, etc. Remember it’s a trend line—so if you take any individual bond and try to plot it on a curve, it might not necessarily lie on the curve, but somewhere around.
For bond’s valuation we are going to assume that the relationship between years-to-maturity and yield-to-maturity of your specific bond copies the trend line drawn from bonds with available market data. Or in other words, we assume that your bond is on our yield curve.
Now, if you can draw a yield curve from bonds with available market data at the certain date, you can easily derive yield-to-maturity for any bond with no market data. You simply look at your curve—for your bond’s years-to-maturity, you will search for yield-to-maturity on the curve. Once you know yield-to-maturity, years-to-maturity, coupon, redemption and other necessary information, you can calculate bond’s estimated market price, or acceptable fair value, at the closing date.
Yes, it’s simple as that. Of course, there are a few things you must be careful when doing so. Let’s put the whole process in the several steps where I explain it:
Step 1—Select appropriate market data
This is particularly important and very judgmental, because to draw appropriate yield curve, you must select certain bonds from the market. But which bonds? In general, you should select bonds with the closest possible characteristics to the bond that you are valuing. It means taking bonds from similar industry or country to ensure that bonds on the market carry similar risks as your bond under question. At the same time, you must prepare a good justification of your selection—just in case, for very diligent auditors.
Step 2—Calculate yield-to-maturity for selected bonds
Market data on the finance servers related to bonds usually contain information about bond’s current market price (or at your specified closing date), coupon, redemption date and redemption value. Sometimes they also contain information about yield-to-maturity, but not always. If not, you have to calculate it by yourself, using the appropriate excel formula “YIELD”. More details and clear demonstration of a calculation are covered in the bonus video How to Extrapolate Along Yield Curve that is part of our IFRS Kit.
Step 3—Draw a yield curve
By now, you should have a series of bonds with their years-to-maturity and yield-to-maturity. I recommend organizing this information into a nice table. Then you can draw a graph where axis X = years-to-maturity and axis Y = yield-to-maturity. You can insert graph using MS Excel and all the things will be done automatically. Moreover, Excel can add a trend line to your graph together with mathematical formula expressing the trend line relationship. This formula is exactly what you need.
Well, our video How to Extrapolate Along Yield Curve in the IFRS Kit shows you step by step how to draw appropriate chart, trend line and derive a formula, so I am not going to dig in a deeper detail here.
Step 4—Calculate yield-to-maturity of valued bonds
Once you worked out mathematical formula of relationship between years-to-maturity and yield to maturity of selected bonds with market data, you can use this formula to calculate yield to maturity of any bond you want to value. Simply replace “x” in the formula with the real years-to-maturity figure for your bond and the result is desired yield-to-maturity.
Step 5—Derive market price of valued bonds
We are approaching our objective—as a final step, we will use the formula “PRICE” in MS Excel. In this formula, you will estimate market price of unquoted bond based on its characteristics including its yield to maturity determined in the step 4. Again, I recommend watching our short video on this topic where this formula is explained very clearly.
WOOOOW! We got it!!! We have estimated fair value of unquoted bonds at our closing date!!!
Now you might think it’s too difficult. But it’s not. In fact, it’s the matter of good internet search for similar quoted instruments, combined with clever application of your MS Excel knowledge.
However, as mentioned above, we have prepared a video How to Value Bonds by Extrapolation Along Yield Curve in the IFRS Kit where we show the whole process in a greater detail. Each step is explained fully with demonstration in MS Excel. You will see how and where to select appropriate market data, how to apply necessary excel formulas, how to draw a yield curve in a few seconds and finally, you can download excel file with our example.
Tags In
JOIN OUR FREE NEWSLETTER AND GET
report "Top 7 IFRS Mistakes" + free IFRS mini-course
Please check your inbox to confirm your subscription.
4 Comments
Leave a Reply Cancel reply
Recent Comments
- Albert on Accounting for gain or loss on sale of shares classified at FVOCI
- Chris Kechagias on IFRS S1: What, How, Where, How much it costs
- atik on How to calculate deferred tax with step-by-step example (IAS 12)
- Stan on IFRS 9 Hedge accounting example: why and how to do it
- BSA on Change in the reporting period and comparatives
Categories
- Accounting Policies and Estimates (14)
- Consolidation and Groups (25)
- Current Assets (21)
- Financial Instruments (56)
- Financial Statements (54)
- Foreign Currency (9)
- IFRS Videos (74)
- Insurance (3)
- Most popular (7)
- Non-current Assets (56)
- Other Topics (15)
- Provisions and Other Liabilities (46)
- Revenue Recognition (27)
- Uncategorized (1)


Hii Silvia. Thanks for making stuff interesting and easy to comprehend. Keep it up!!
Hello Sir, thanks for the article, it was really helpful! I would be much grateful if you could send me the link to your short vídeo and also the excel file. Thanks
Kind regards
Love this article however I did not find the link for the excel download
This is my first time i visit here. I found so many entertaining stuff in your blog! Keep up the good work.
Regards: